Setting Up Sentry APM for Python Microservices
Why Sentry?
When running Python microservices in production, you need visibility into what's happening. Sentry provides Application Performance Monitoring (APM) that captures errors, traces requests, and profiles your code—all without significant overhead.
In this post, I'll walk through how we set up Sentry for a Flask-based microservice running on Google Cloud Run.
Installation
First, install the Sentry SDK with the integrations you need:
pip install sentry-sdk[flask,pymongo]
The optional extras (flask, pymongo) pull in the specific integrations for your stack.
Basic Configuration
Here's a production-ready Sentry setup for Flask:
import os
import sentry_sdk
from sentry_sdk.integrations.flask import FlaskIntegration
from sentry_sdk.integrations.logging import LoggingIntegration
from sentry_sdk.integrations.pymongo import PyMongoIntegration

# Cloud Run provides these environment variables
service_name = os.environ.get("K_SERVICE", "unknown")
revision = os.environ.get("K_REVISION", "unknown")

sentry_sdk.init(
    dsn=os.environ.get("SENTRY_DSN"),
    release="local" if revision == "unknown" else revision,
    environment="dev" if service_name == "unknown" else "production",
    send_default_pii=True,
    traces_sample_rate=0.1,
    profile_session_sample_rate=0.1,
    profile_lifecycle="trace",
    integrations=[
        FlaskIntegration(),
        LoggingIntegration(),
        PyMongoIntegration(),
    ],
    enable_logs=True,
)
Let's break down what each option does.
Configuration Deep Dive
Release & Environment
release="local" if revision == "unknown" else revision,
environment="dev" if service_name == "unknown" else "production",
Cloud Run sets K_SERVICE and K_REVISION automatically. Using these lets you:
- Track which deployment introduced a bug
- Filter issues by environment (dev vs production)
- See regression analysis across releases
When running locally, these default to "unknown", so we fall back to "local" and "dev".
Sample Rates
traces_sample_rate=0.1,
profile_session_sample_rate=0.1,
We sample 10% of requests for tracing and profiling. This keeps costs manageable while providing enough data to identify performance issues.
Tip: Start with 0.1 (10%) and adjust based on your traffic. High-traffic services might need 0.01 (1%) or lower.
Integrations
Sentry integrations automatically instrument your code:
| Integration | What it captures |
|---|---|
FlaskIntegration() |
HTTP requests, response times, errors |
LoggingIntegration() |
Python log messages attached to events |
PyMongoIntegration() |
MongoDB query spans and slow queries |
Other useful integrations:
CeleryIntegration()- async task trackingRedisIntegration()- cache operationsSqlalchemyIntegration()- SQL queries
Feature Flag Pattern
We wrap initialization in a feature flag check:
if os.environ.get("SENTRY_ENABLED") == "enabled":
    sentry_sdk.init(...)
This lets us:
- Disable Sentry locally without code changes
- Turn off monitoring during maintenance windows
- A/B test monitoring overhead (if you're paranoid)
What You Get
Once configured, Sentry provides powerful dashboards out of the box. Here's what our production monitoring looks like:
Backend Performance Summary
The backend summary gives you an at-a-glance view of your service health—throughput, latency percentiles, and failure rates over time.
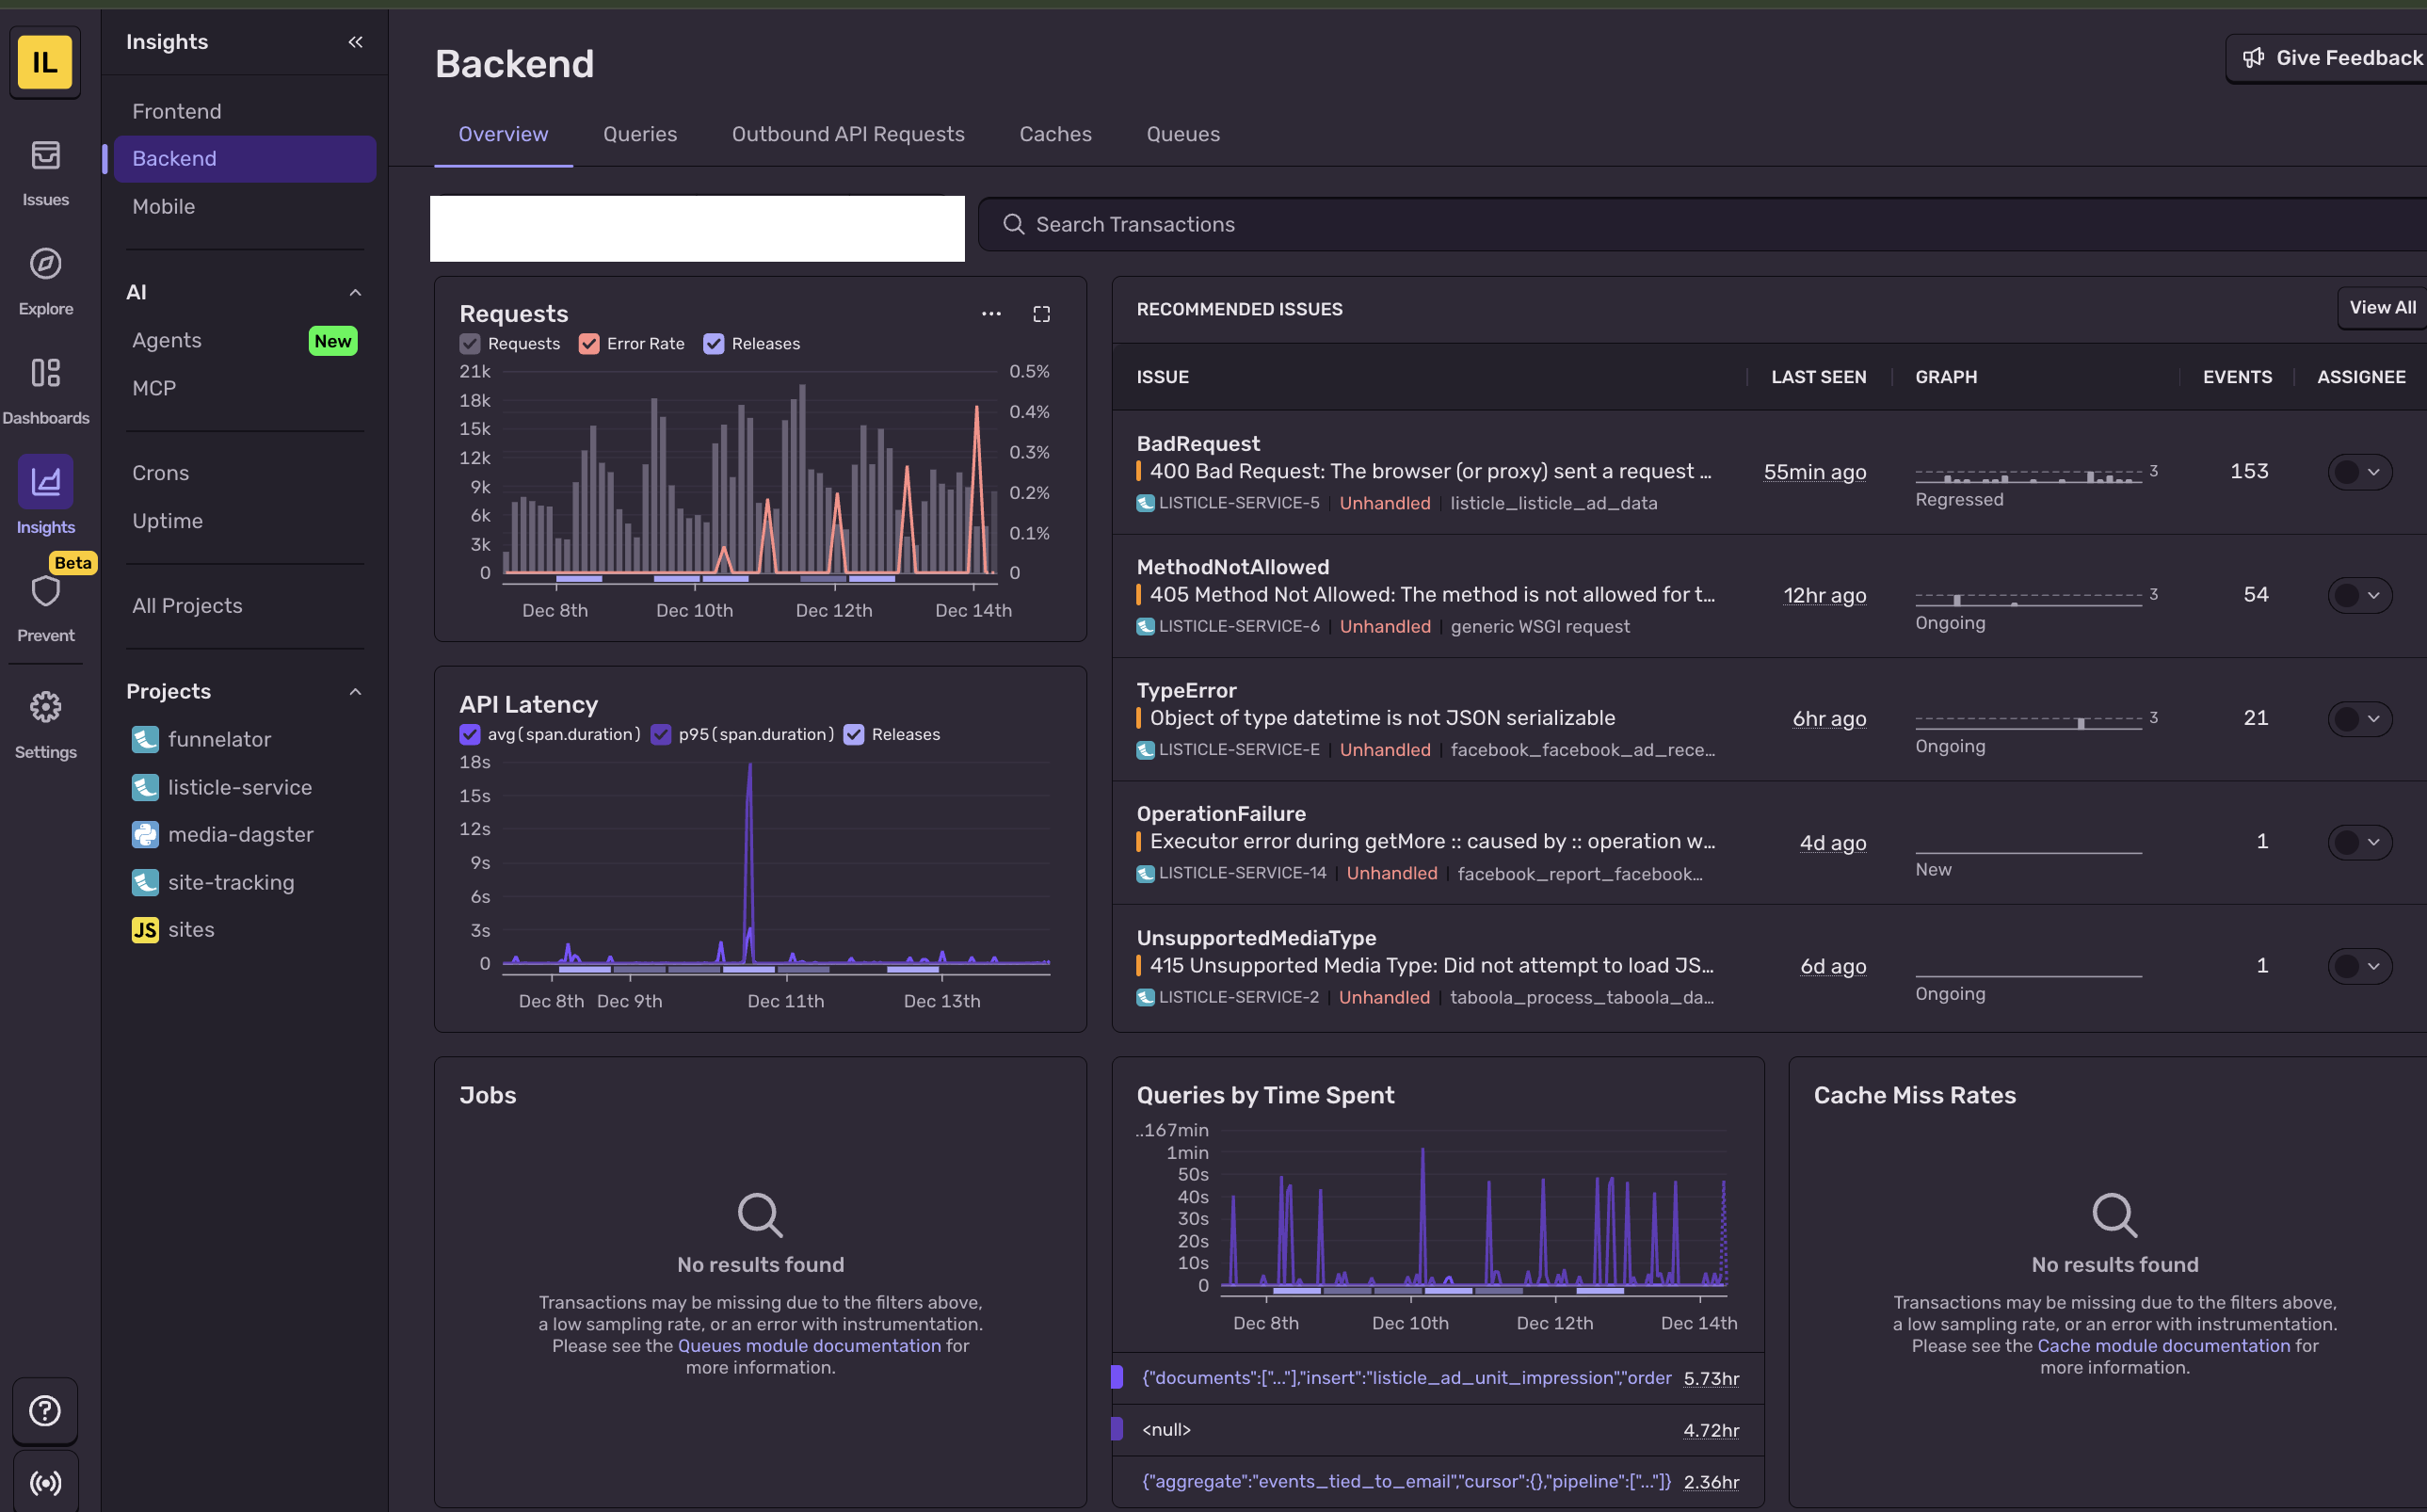
You can drill down into specific endpoints to see where time is being spent:

Database Query Monitoring
The PyMongoIntegration automatically captures every database query, letting you identify slow queries and N+1 problems:

Outgoing HTTP Requests
Track external API calls and their latencies. This is invaluable for debugging timeout issues or identifying slow third-party dependencies:

Error Feed
When things go wrong, Sentry captures full stack traces with local variables and groups similar errors together:

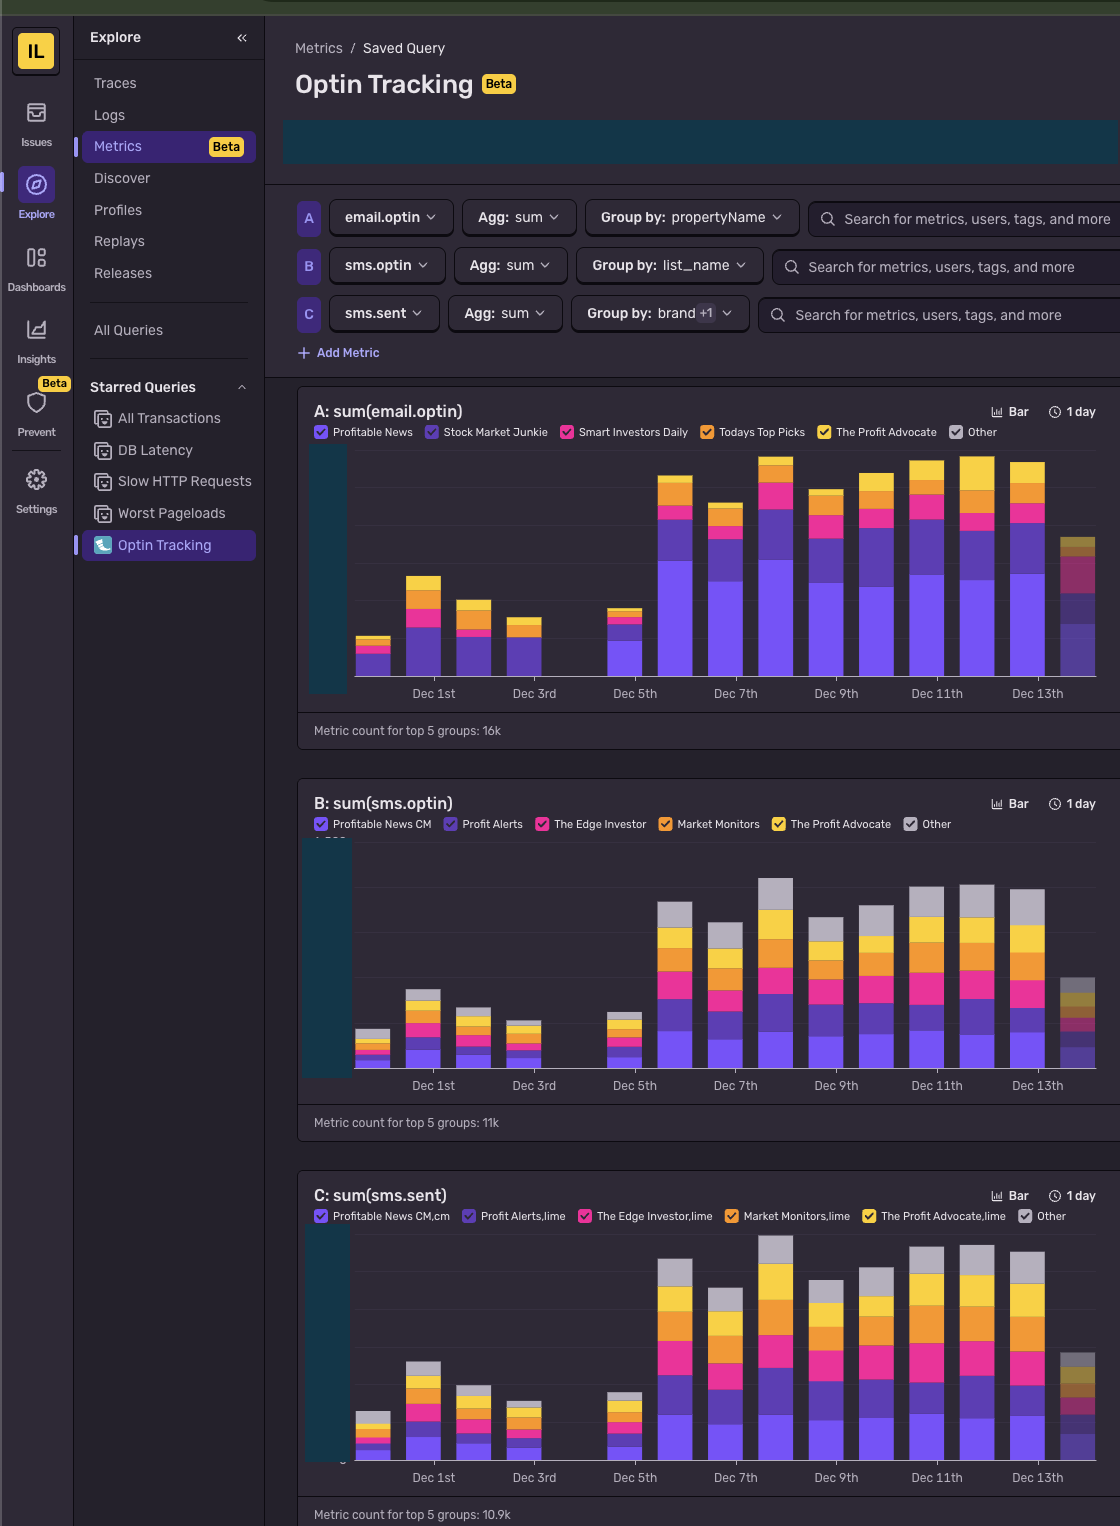
Custom Metrics
Beyond automatic instrumentation, you can track custom business metrics with just a few lines of code:
from sentry_sdk import metrics

# Count events with dimensions
metrics.count(
    "sms.sent",
    successful_count,
    attributes={"provider": "twilio", "brand": "alerts"},
)

metrics.count(
    "sms.sent_error",
    error_count,
    attributes={"provider": "twilio", "brand": "alerts"},
)

# Track distributions (latency, sizes, etc.)
metrics.distribution(
    "api.response_time",
    response_time_ms,
    attributes={"endpoint": "/users", "method": "GET"},
)

# Gauges for current values
metrics.gauge(
    "queue.depth",
    current_queue_size,
    attributes={"queue_name": "emails"},
)
The attributes parameter lets you slice and dice metrics in Sentry's dashboard:
Best Practices
- Keep sample rates low in production - 5-10% is usually enough
- Use releases - Deploy tracking is invaluable for debugging regressions
- Set up alerts - Configure Slack/email notifications for new issues
- Ignore noise - Filter out expected errors (404s, health checks) in Sentry settings
Conclusion
Sentry APM gives you production visibility without invasive code changes. The Flask integration handles most of the work—you just need to initialize it early in your application lifecycle.
The key is finding the right balance: enough sampling to catch issues, not so much that you're drowning in data or burning through your quota.